📊 Statistics
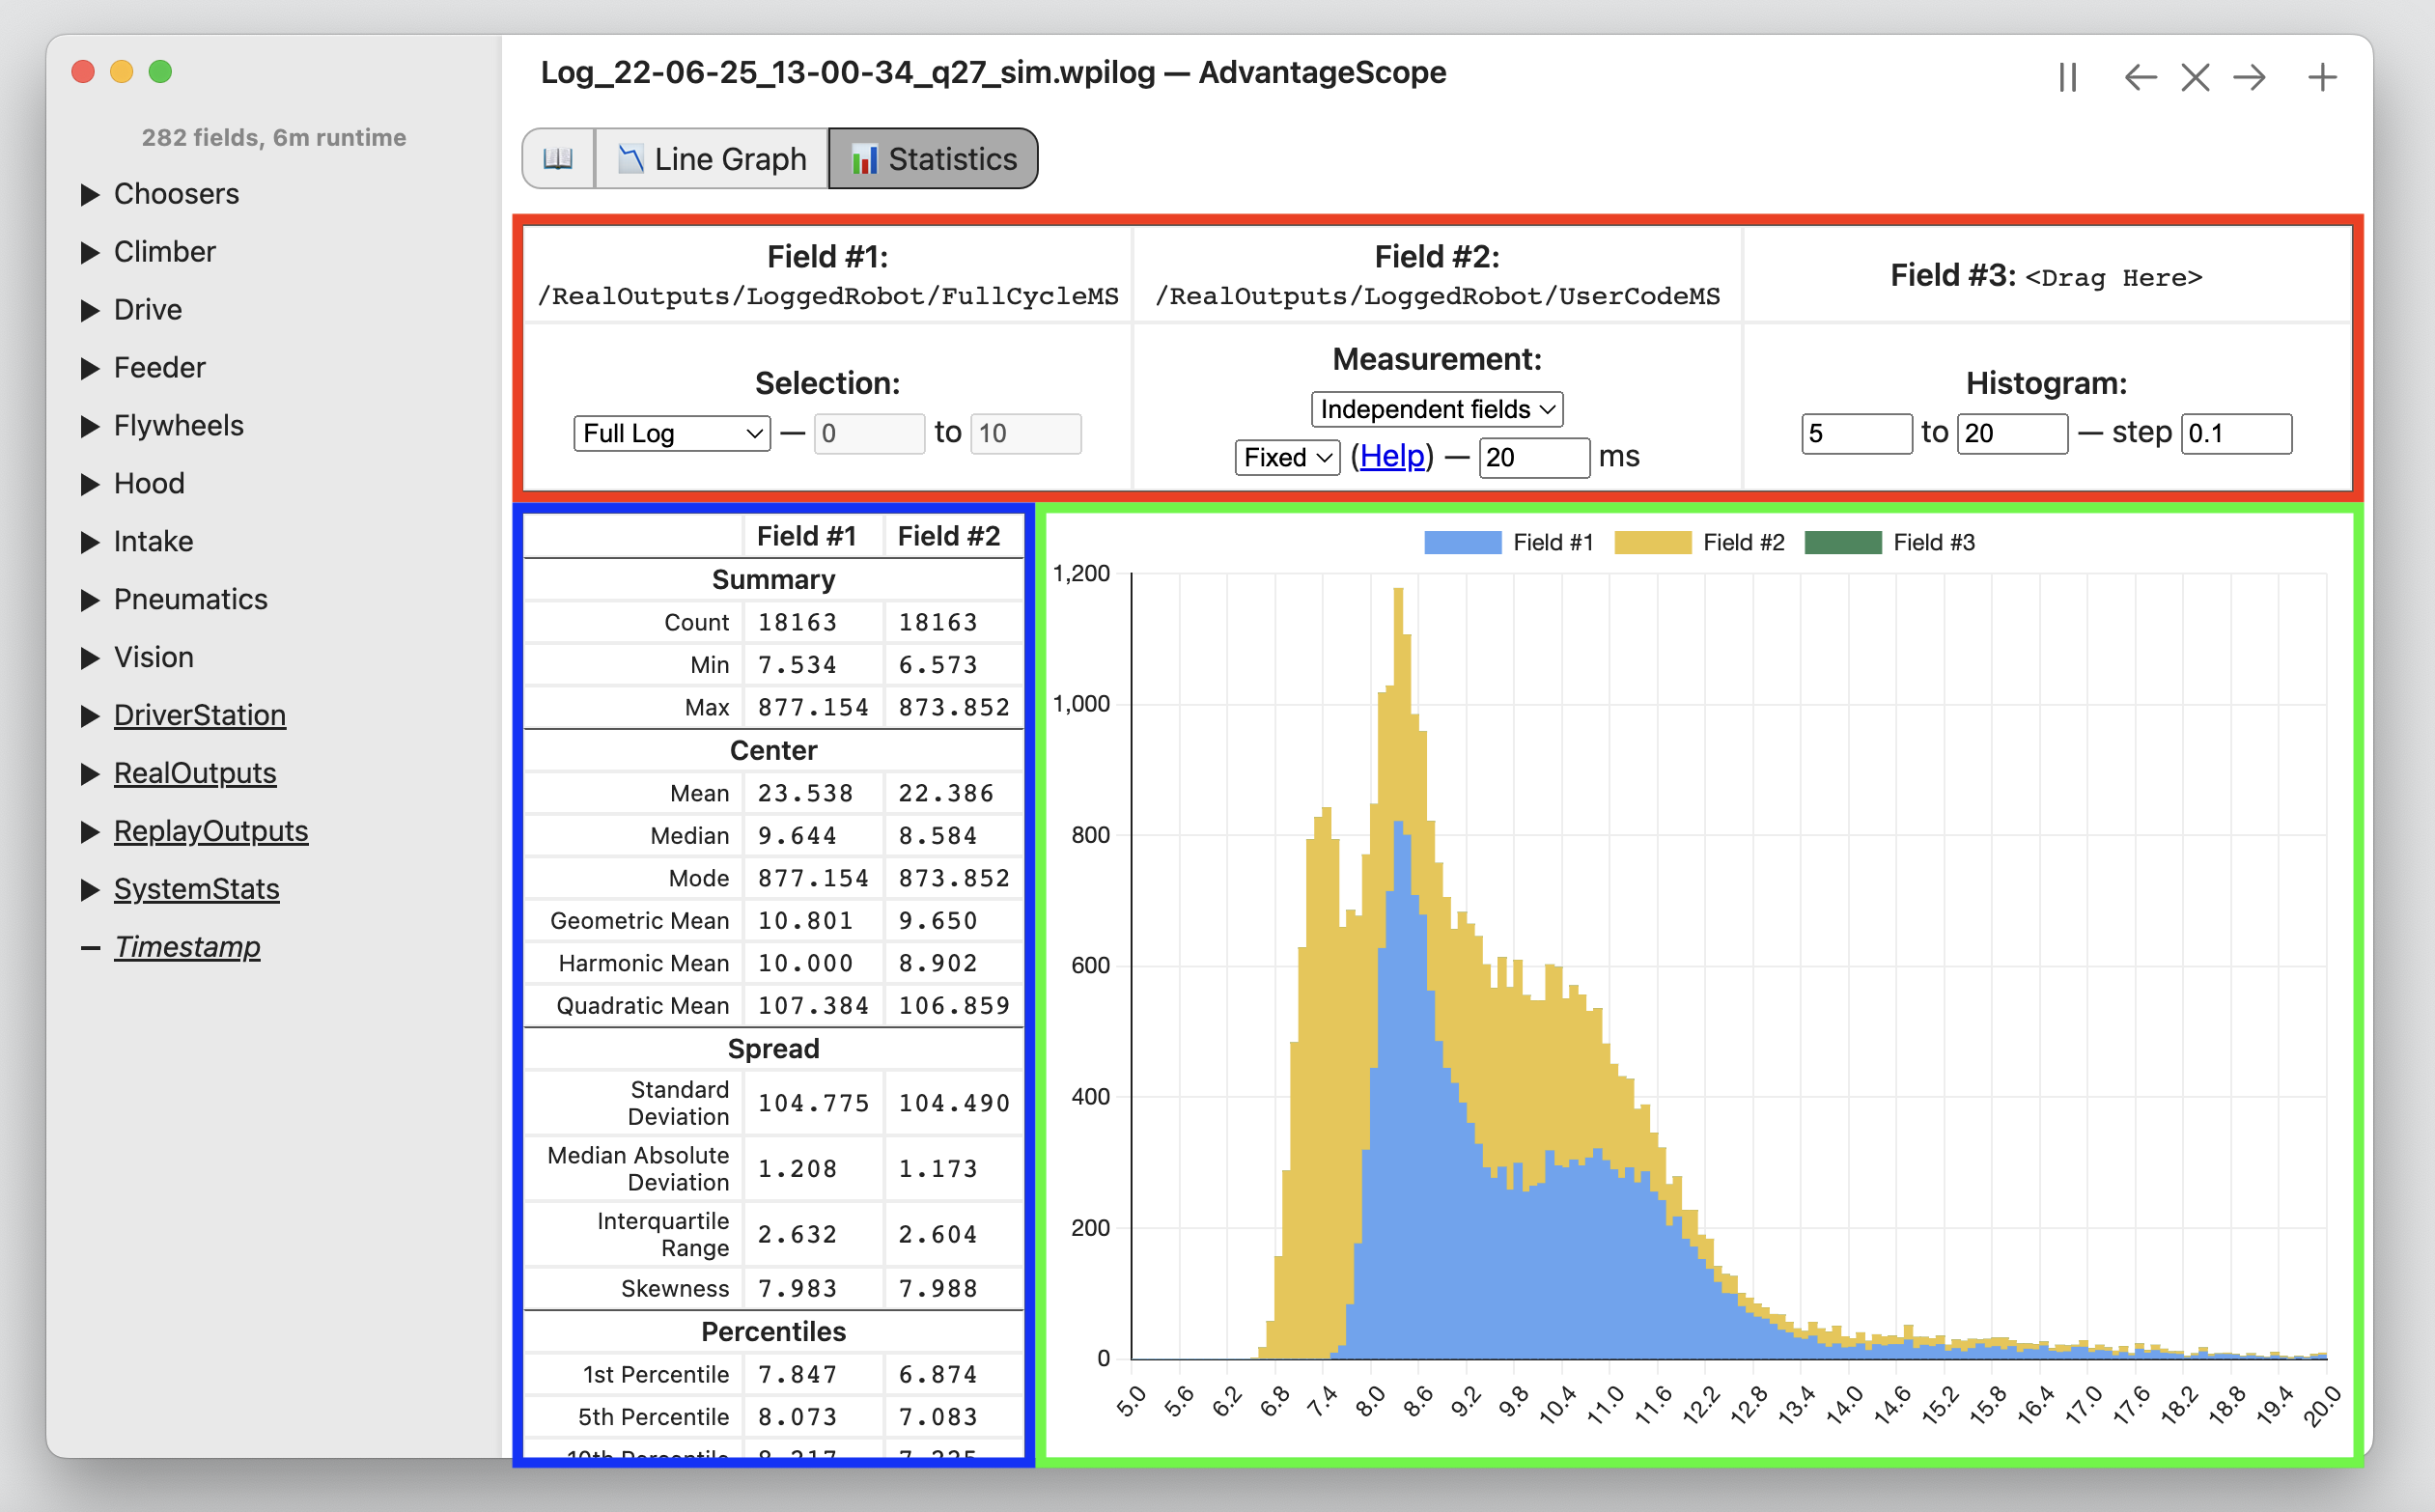
The statistics tab allows for deep statistical analysis of numerical fields, analyzing overall trends rather than changes over time. The selected fields are analyzed using a histogram and a variety of standard statistical measures. The key sections of the tab are shown here:
Configuration
The configuration (red) section contains the displayed fields and the settings used during analysis. To add a field, drag it to one of the labeled boxes. To remove a field, right-click the box. All of the analysis settings are liste below.
Selection
- Selection Type: Sets the time range(s) to anlyze. See options below.
- Full Log: Analyzes the full range of the log file.
- Enabled Only: Analyzes time ranges where the robot is enabled.
- Time Range: Analyzes a custom time range.
- Range: If Time Range is selected, defines the range to analyze in seconds.
Measurement
- Measurement Type: Sets how the fields are interpreted. See options below.
- Independent fields: Analyzes up to three fields separately (including the histogram and statistical measures).
- Relative error: Analyzes up to two measurement fields relative to a reference field. At each timestamp, the values of the fields are equal to "measurement - reference".
- Absolute error: Analyzes up to two measurements fields relative to a reference field, but taking the absolute value of the error. At each timestamp, the values of the fields are equal to "abs(measurement - reference)"
- Sampling: Sets how discrete samples are captured from timestamped data. See options below.
- Fixed: Generates discrete samples at a constant time interval (recommended in most cases). Set the sampling period to adjust how often samples are generated; this should generally equal the period of the robot controller.
- Auto: Generates discrete samples whenever any field is updated, producing one sample for each loop cycle. This option should only be used on timestamp synchronized logs, like those produced by AdvantageKit.
Histogram
- Range: The min and max values to display on the histogram. Data outside this range is not shown, but it continues to be used for the statistical measures.
- Step: The size of each histogram bin. Smaller values produce more detailed graphs, but also reveal more noise.
Statistical Measures
The table of statistical measures (blue) shows the calculated values of each measure for the provided fields. Discrete samples are generated using the configured selection and sampling mode, then analyzed. More information on each measure is provided below.
Summary
- Count: The number of discrete samples generated.
- Min: The smallest value in the data.
- Max: The largest value in the data.
Center
- Mean: The arithmetic mean (simple average) of the data.
- Median: The "middle" value of the data, or the 50% percentile.
- Mode: The most common value in the data.
- Geometric Mean: A measure of center calculated using the product of the values rather than the sum. Applicable when measuring exponential growth rates (like percent change between cycles).
- Harmonic Mean: A measure of center calculated using the sum of the reciprocals of the values. Applicable when measuring rates or velocities.
- Quadratic Mean: A measure of center calculated using the squares of the values. Applicable when measuring data with both positive and negative values, like periodic motion.
Spread
- Standard Deviation: The most common statistical measure of variation, where a lower value indicates less variation. 68% of the data falls within one standard deviation of the mean.
- Mean Absolute Deviation: The average distance between each value and the mean. This is an alternative to the standard deviation.
- Interquartile Range: The difference between the third and first quartiles (75th percentile and 25th percentile), less affected by outliers than the standard deviation or mean absolute deviation.
- Skewness: A measure of the asymmetric skew of the data. A negative value indicates a tail to the left, a positive value indicates a tail to the right, and a zero value suggests a symmetric distribution.
Percentiles
The percentiles measure values below which the given percentage of other values fall. For example, 10% of values fall below the 10th percentile. The following percentiles are also known as:
- 25th Percentile = 1st quartile (Q1)
- 50th Percentile = 2nd quartile (Q2) = median
- 75th Percentile = 3rd quartile (Q3)
Histogram
The histogram (green)shows the number of samples that fall in each bin, within the specific range. Note that data outside the specified range is discarded (rather than being grouped into a separate bin). For more information about how to interpret a histogram, see this video.