📍 Points
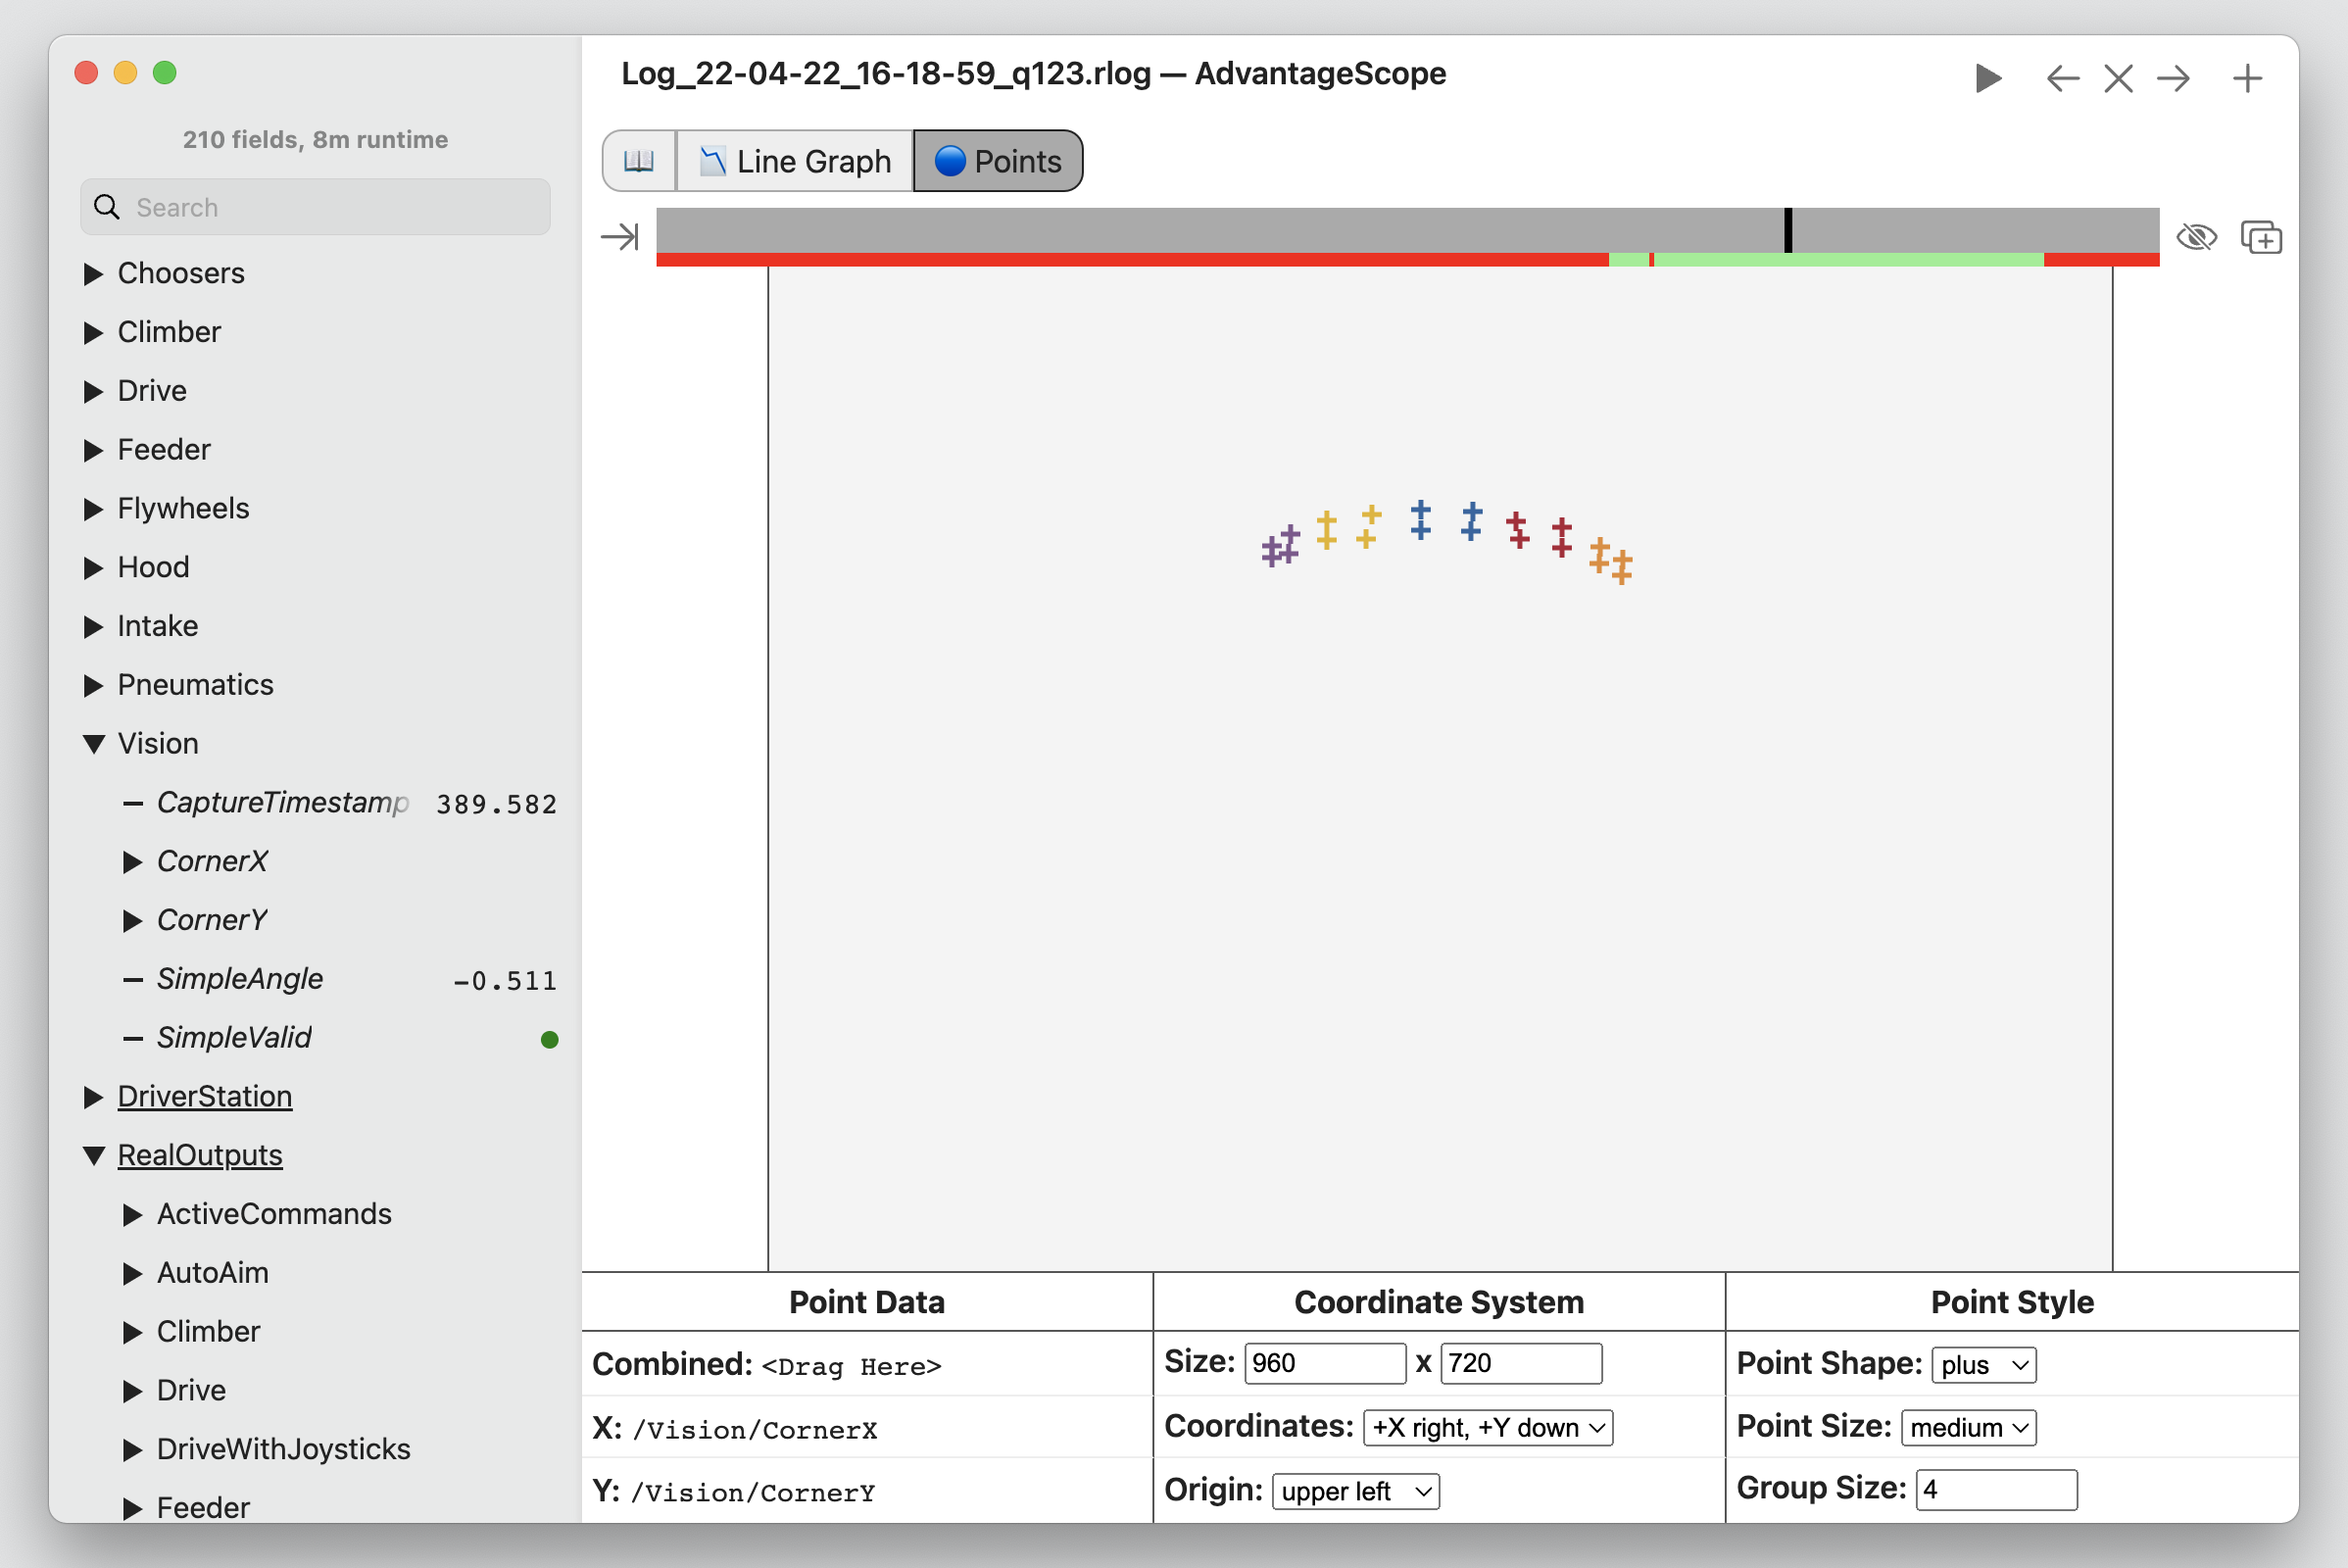
The points tab shows a 2D visualization of arbitrary points. This is a very flexible tool, allowing for custom visualizations of vision data/pipelines, mechanism states, etc. The timeline shows when the robot is enabled and can be used to navigate through the log data.
Note: To view the point visualization alongside other tabs, click the "Add Window" icon just below the navigation/playback controls. To hide the controls at the bottom of the window, click the eye icon.
Point Data
Three formats for point data are supported:
- Recommended: An array of struct-encoded
Translation2dobjects. Drag the field to the "Combined" box to visualize it. - A single numeric array containing X and Y values, following the format
[x_1, y_1, x_2, y_2, ...]. Drag the field to the "Combined" box to visualize it. - Two numeric arrays of the same length containing X and Y values separately. Drag the fields to the "X" and "Y" boxes to visualize them.
The example code below shows how to log an array of Translation2d objects using WPILib or AdvantageKit.
Translation2d[] translations = new Translation2d[] {
    new Translation2d(0.0, 1.0),
    new Translation2d(2.0, 3.0),
    new Translation2d(4.0, 5.0)
};

// WPILib
StructArrayPublisher<Translation2d> publisher = NetworkTableInstance.getDefault()
    .getStructArrayTopic("MyTranslations", Translation2d.struct).publish();

periodic() {
    publisher.set(new Translation2d[] {
        new Translation2d(0.0, 1.0),
        new Translation2d(2.0, 3.0)
    });
    publisher.set(
        new Translation2d(0.0, 1.0),
        new Translation2d(2.0, 3.0)
    );
}

// AdvantageKit
Logger.recordOutput("MyTranslations",
    new Translation2d[] {
        new Translation2d(0.0, 1.0),
        new Translation2d(2.0, 3.0)
    });
Logger.recordOutput("MyTranslations",
    new Translation2d(0.0, 1.0),
    new Translation2d(2.0, 3.0)
);
Configuration
The following configuration options are available:
- Size: The dimensions of the display area. This can use any units that match the published points. When displaying vision data, this is the resolution of the camera.
- Coordinates: The coordinate system to use (orientation of X and Y axes).
- Origin: The position of the origin in the coordinate system.
- Point Shape: The shape of each rendered point (plus, cross, or circle).
- Point Size: The size of each rendered point (large, medium, or small).
- Group Size: The number of points in each color coded group (for example, a group size of four could be used for vision corner data). Setting a group size of zero will disable color coding.